Problem Statement
We inherited an EKS cluster that was originally set up in 2020. About two months ago—based on the dashboard timeline—the cluster-autoscaler Pod started failing in a CrashLoopBackOff cycle. The Pod would start, run for about 50 seconds, then get terminated with OOMKilled. Restart count: 16,865.
The cluster had the required ASG tags (k8s.io/cluster-autoscaler/enabled and k8s.io/cluster-autoscaler/ditac-usa-devqa), so the autodiscovery mechanism should have worked. But the Pod kept dying.
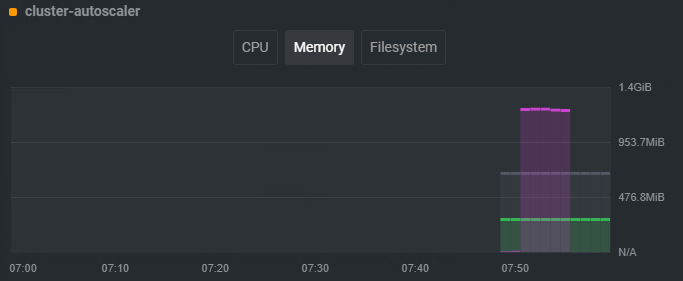
kubectl describe pod cluster-autoscaler-9797c4d69-m2scx -n kube-system
The critical bits from describe:
Image: us.gcr.io/k8s-artifacts-prod/autoscaling/cluster-autoscaler:v1.16.5
State: Waiting
Reason: CrashLoopBackOff
Last State: Terminated
Reason: OOMKilled
Exit Code: 137
Restart Count: 16865
Limits:
  cpu: 100m
  memory: 300Mi
Requests:
  cpu: 100m
  memory: 300Mi
The logs showed the CA starting up normally, acquiring the leader lease, and beginning to list/watch Pods and Nodes:
I0326 17:34:36.484427 1 reflector.go:120] Starting reflector *v1.Pod (1h0m0s) from ...
I0326 17:34:36.484948 1 reflector.go:120] Starting reflector *v1.Node (1h0m0s) from ...
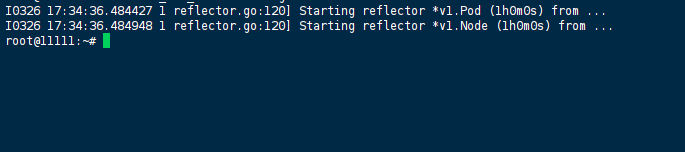
Then—silence. The Pod would OOM before any scale-up/down decisions could be logged.
Failed Attempts
Attempt 1: Bumping the Memory Limit
What we tried: We edited the Deployment to increase resources.limits.memory from 300Mi to 600Mi, then 1Gi.
kubectl edit deployment cluster-autoscaler -n kube-system
# Changed memory limit to 600Mi
What we expected: More memory → no OOM → stable Pod.
What actually happened: The Pod ran slightly longer—maybe 70–80 seconds—but still crashed with Exit Code: 137. The OOMKilled reason persisted. We checked the Pod’s actual memory usage right before termination by exec’ing in and running:
kubectl exec -it cluster-autoscaler-xxx -n kube-system -- cat /sys/fs/cgroup/memory/memory.usage_in_bytes
The usage was climbing past the limit within a minute of startup. Memory wasn’t the root cause—it was a symptom of something else consuming memory during initialization.
Attempt 2: Re-Checking ASG Tags and IAM Permissions
What we tried: We double-checked every ASG tag in the AWS Console. The required tags were present:
text
Key: k8s.io/cluster-autoscaler/enabled
Value: true

Key: k8s.io/cluster-autoscaler/ditac-usa-devqa
Value: owned
We also verified the IAM role attached to the EC2 instance had the correct autoscaling:DescribeAutoScalingGroups and autoscaling:UpdateAutoScalingGroup permissions.
What we expected: Maybe a missing tag or missing permission was causing CA to error out and crash.
What actually happened: The logs showed CA successfully discovering node groups:
FLAG: --node-group-auto-discovery="[asg:tag=k8s.io/cluster-autoscaler/enabled,k8s.io/cluster-autoscaler/ditac-usa-devqa]"
And we saw the leader election succeed:
Event: cluster-autoscaler-9797c4d69-m2scx became leader

So the CA was finding the ASGs. It just couldn’t stay alive long enough to do anything with them. Permissions and tags were not the issue.
Attempt 3: Tuning --scan-interval and Scale-Down Timers
What we tried: We added startup arguments to reduce the operational frequency:
--scan-interval=30s
--scale-down-unneeded-time=15m0s
--scale-down-delay-after-add=15m0s
What we expected: Less frequent scanning → less memory churn → fewer OOMs.
What actually happened: No improvement. The CA still OOM’d during the initial LIST/WATCH phase before the first scan interval even fired. We confirmed this by tailing the logs:
kubectl logs cluster-autoscaler-9797c4d69-m2scx -n kube-system --tail=50
The logs showed reflector startup (Starting reflector *v1.Pod, Starting reflector *v1.Node), then nothing—the Pod would crash before completing the initial sync. The scan interval parameter only affects periodic scans after the initial cache sync, which was never completing.
Attempt 4: Checking for Memory Leak Patterns
What we tried: We compared memory usage across a few restart cycles:
kubectl get pod cluster-autoscaler-9797c4d69-m2scx -n kube-system -o yaml | grep -A5 "lastState"
We noticed the Started and Finished timestamps were consistently ~50–60 seconds apart:
Started: Sat, 26 Mar 2022 23:04:35 +0530
Finished: Sat, 26 Mar 2022 23:05:25 +0530
That meant the Pod crashed at roughly the same point in startup every time—during the initial listing of cluster resources. This wasn’t a gradual leak; it was a spike during initialization.
Root Cause Analysis
The smoking gun was the image tag: v1.16.5.
Cluster Autoscaler v1.16.5 was released in early 2020. The cluster was set up in 2020, and the CA Pod had been running that same version ever since. Over time, the cluster grew—more nodes, more Pods, more ReplicationControllers—and the CA’s memory footprint during the initial LIST/WATCH phase expanded beyond the configured 300Mi limit.
We confirmed this by checking the cluster size:
kubectl get nodes --no-headers | wc -l
# Output: [redacted, but > 50 nodes]
CA v1.16.5 uses informers that list all Pods, Nodes, and ReplicationControllers during startup. In a large cluster, that initial list can be several hundred megabytes. The 300Mi limit was simply insufficient for the cluster’s current scale, and the CA’s internal memory management in that old version wasn’t optimized for large-scale clusters.
We also noticed the flag --memory-total="0:6400000"—this is CA’s global memory constraint, but it doesn’t override the Pod’s cgroup limit. The Pod was getting killed by the kernel OOM killer at the cgroup level, not by CA’s internal logic.
Solution
Step 1: Determine the Correct CA Version for Your EKS Control Plane
Cluster Autoscaler versions must match the Kubernetes control plane version. Check your control plane version:
kubectl version --short
For EKS, consult the official compatibility matrix. At the time of this writing, for Kubernetes 1.21–1.24, use CA v1.21.x through v1.24.x accordingly.
We were on EKS 1.21, so we chose v1.21.5 (the latest patch at the time).
Step 2: Update the Deployment Image
kubectl set image deployment/cluster-autoscaler -n kube-system \
  cluster-autoscaler=us.gcr.io/k8s-artifacts-prod/autoscaling/cluster-autoscaler:v1.21.5
Step 3: Adjust Resource Limits Realistically
300Mi was too low for a cluster of our size. We increased both requests and limits:
resources:
  requests:
    cpu: 100m
    memory: 512Mi
  limits:
    cpu: 200m
    memory: 1Gi
We set requests lower than limits to allow for burst during startup, but kept limits at 1Gi to prevent runaway consumption.
kubectl patch deployment cluster-autoscaler -n kube-system --type='json' \
  -p='[{"op": "replace", "path": "/spec/template/spec/containers/0/resources/limits/memory", "value": "1Gi"}]'
Step 4: Verify the New Pod
kubectl get pods -n kube-system | grep cluster-autoscaler
The new Pod came up with Running status and Restart Count: 0.
We monitored memory usage:
kubectl top pod cluster-autoscaler-<new-hash> -n kube-system
Steady-state memory usage dropped to ~200–250Mi—well within the new 1Gi limit. The CA successfully acquired the leader lease, completed the initial cache sync, and started making scaling decisions.
Verification
We let the Pod run for 24 hours and checked the restart count:
kubectl describe pod cluster-autoscaler-<new-hash> -n kube-system | grep "Restart Count"
Output: Restart Count: 0
The BackOff events stopped. The CA was now stable.
Key Takeaways
OOMKilledwithExit Code 137does not always mean “add more memory.” It means the process exceeded its cgroup limit. The underlying cause could be a memory leak, a large initial data load, or—as in this case—a version that doesn’t handle the cluster’s scale efficiently.- Check the image version first. Cluster Autoscaler is tightly coupled to the Kubernetes version. Running a 2+ year old version (
v1.16.5in 2022) is a recipe for instability, especially as the cluster grows. - The initial LIST/WATCH phase is memory-intensive. CA
v1.16.5lists all Pods, Nodes, and ReplicationControllers on startup. In a large cluster, that can easily exceed 300Mi. Newer versions have improved memory efficiency and incremental listing. - Don’t waste time tuning
--scan-intervalor scale-down timers if the Pod is OOM’ing during startup. Those flags only affect behavior after the initial cache sync completes. - Set realistic resource requests and limits. A 300Mi limit might have been fine for a small cluster in 2020, but clusters grow. Re-evaluate CA resource limits periodically, especially after adding nodes or workloads.
Commands Reference
# Check CA image version
kubectl describe pod -n kube-system -l app=cluster-autoscaler | grep Image:

# Check restart count
kubectl describe pod -n kube-system -l app=cluster-autoscaler | grep "Restart Count"

# Update CA image
kubectl set image deployment/cluster-autoscaler -n kube-system \
  cluster-autoscaler=us.gcr.io/k8s-artifacts-prod/autoscaling/cluster-autoscaler:v1.21.5

# Patch memory limit
kubectl patch deployment cluster-autoscaler -n kube-system --type='json' \
  -p='[{"op": "replace", "path": "/spec/template/spec/containers/0/resources/limits/memory", "value": "1Gi"}]'

# Monitor CA memory usage
kubectl top pod -n kube-system -l app=cluster-autoscaler
