When a Kubernetes pod repeatedly crashes with OOMKilled and Exit Code: 137, the standard reaction—doubling the memory limit in the deployment YAML and hoping the alert clears—is a recipe for resource waste and future node-level outages. While migrating our Prometheus ingestion pipeline and a suite of Go/Node.js backend services to a high-density cluster, we ran into a pattern of silent, sudden container terminations where traditional metrics completely missed the failure window.
To permanently eliminate OOM loops, you have to trace the execution from the Kubernetes API down to the Linux kernel’s Out-Of-Memory (OOM) Killer, fix the underlying runtime heap allocations, and establish automated rightsizing baselines. Here is the exact troubleshooting diagnostic and remediation workflow we use in production.
1. The Initial Triage: Why kubectl top Lies to You
When our analytics ingestion pods began crash-looping under heavy traffic, querying kubectl top pods showed memory utilization hovering safely around 60% of the allocated quota. Relying on real-time metrics during an OOM investigation is misleading: Prometheus and Kubernetes metrics server scrape at 15- to 30-second intervals. A sudden memory spike from an unbuffered database query or a garbage collection freeze will breach the container limit and trigger a kernel kill in milliseconds, leaving zero trace on a Grafana dashboard.
To get the actual ground truth, pull the container’s termination state directly from the API server:
kubectl get pod analytics-ingestion-7c88f5d69-x4vj2 -n production -o yaml | grep -A 8 "lastState:"
An OOM kill leaves an unmistakable signature in the .status.containerStatuses payload:
    lastState:
      terminated:
        containerID: containerd://a9f3b821734e0984182937401928374829102938475610293847561029384756
        exitCode: 137
        finishedAt: "2026-07-11T06:14:22Z"
        reason: OOMKilled
        startedAt: "2026-07-11T04:02:11Z"
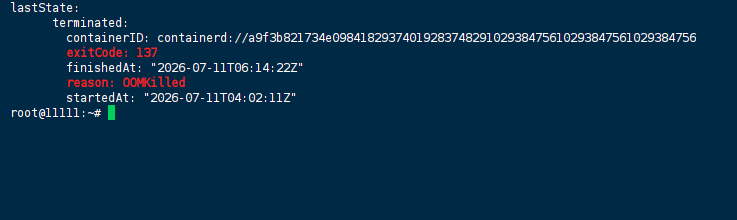
The Exit Code: 137 is the universal POSIX indicator that the target process was forcibly terminated by SIGKILL (signal 9, calculated as $128 + 9 = 137$). Because Kubernetes does not support swap space by default, the Linux kernel terminates the process the exact microsecond it attempts to allocate memory beyond its cgroup boundary.
2. Digging into Kernel Space: Verifying cgroup Memory Exhaustion via dmesg
Seeing OOMKilled in the Kubernetes API does not tell you what triggered the kill. It could be a single container exceeding its configured limits.memory, or it could be an unconstrained container on the same worker node exhausting physical RAM, forcing the host kernel to shoot down random pods to save the node.
To isolate the blast radius, we SSHed into the underlying worker node (worker-node-04) and inspected the kernel ring buffer for the exact OOM invocation:
dmesg -T | grep -B 2 -A 8 -i "oom-kill"
On a cgroups v2 node, an application breaching its individual container limit outputs a distinct cgroup path and usage trace:
[Sat Jul 11 06:14:22 2026] oom-kill:constraint=cgroup_of_process,nodemask=(null),cpuset=76c49646bda5ef7bbce3210dd913c,mems_allowed=0,oom_memcg=/kubepods.slice/kubepods-burstable.slice/kubepods-burstable-podf8b3c102_9821_43a1_b321_123456789abc.slice/docker-a9f3b821734e0984182937401928374829102938475610293847561029384756.scope,task_memcg=/kubepods.slice/kubepods-burstable.slice/kubepods-burstable-podf8b3c102_9821_43a1_b321_123456789abc.slice/docker-a9f3b821734e0984182937401928374829102938475610293847561029384756.scope,task=node,pid=41923,uid=1000
[Sat Jul 11 06:14:22 2026] Memory cgroup out of memory: Killed process 41923 (node) total-vm:3412984kB, anon-rss:2097152kB, file-rss:4096kB, shmem-rss:0kB, UID:1000 pgtables:4192kB oom_score_adj:998
[Sat Jul 11 06:14:22 2026] oom_reaper: reaped process 41923 (node), now anon-rss:0kB, file-rss:0kB, shmem-rss:0kB

Notice the line oom_memcg=/kubepods.slice/.... This confirms the container hit its own cgroup memory ceiling (anon-rss:2097152kB, or exactly 2Gi).
However, during one debugging session, we noticed the oom_memcg path pointing to the root slice (/), while the killed process was kubelet. When developers deploy pods without memory limits in cgroups v1 environments (or misconfigured v2 nodes), those containers share the root memory cgroup with system daemons. A memory leak in an unconstrained pod will drain host RAM, causing the kernel to kill kubelet or sshd, dropping the node into a NotReady state and causing cluster-wide scheduling freezes.
To prevent naked pods from taking down worker nodes, immediately enforce a namespace-level LimitRange:
apiVersion: v1
kind: LimitRange
metadata:
  name: mandatory-memory-boundaries
  namespace: production
spec:
  limits:
  - default:
      memory: "512Mi"
      cpu: "500m"
    defaultRequest:
      memory: "256Mi"
      cpu: "100m"
    type: Container
3. Stopping Node Avalanches: Hardening Kubelet Eviction Thresholds
Even with pod limits in place, nodes can experience severe memory pressure if the total allocated requests are too dense. By default, Kubelet’s hard eviction threshold is hardcoded to an absolute, extremely low value: memory.available<100Mi.
On our 64GB and 128GB worker nodes, waiting until only 100MB of RAM remains is fatal. As physical memory drops below 1GB, the Linux kernel aggressively reclaims Page Cache. This causes massive disk I/O thrashing and spikes CPU wait times across every pod on the node before Kubelet ever initiates eviction.
To ensure Kubelet evicts offending pods before the operating system begins thrashing, we edited /var/lib/kubelet/config.yaml across our worker nodes to use percentage-based soft and hard thresholds:
apiVersion: kubelet.config.k8s.io/v1beta1
kind: KubeletConfiguration
evictionHard:
  memory.available: "5%"
  nodefs.available: "10%"
evictionSoft:
  memory.available: "10%"
evictionSoftGracePeriod:
  memory.available: "1m"
evictionPressureTransitionPeriod: "30s"
After restarting the Kubelet daemon (systemctl restart kubelet), the node begins evicting pods exceeding their requested quota (prioritizing BestEffort QoS workloads) the moment node memory drops below 10% (~6.4GB on a 64GB node), preserving system Page Cache and node stability.
4. The Root Cause: Fixing Language Runtime Heap Blindness (Go & Node.js)
When we traced the OOM events back to the application code, we found that the pods weren’t necessarily leaking memory—their language runtimes were simply blind to Kubernetes cgroup limits. When a JVM, Node.js V8 engine, or Go runtime initializes, it queries the host OS for total physical memory. If running on a 64GB worker node, an unconfigured runtime assumes it has 64GB of heap space available, even if Kubernetes enforces a 2GB container limit.
Go Runtime (GOMEMLIMIT) and HTTP Client Leaks
Our Go-based ingestion microservices were crashing several times a day. While Go 1.19+ introduced GOMEMLIMIT, omitting it causes the Go garbage collector (GC) to wait too long before triggering a sweep cycle. By the time the GC wakes up, the container has already crossed the cgroup limit and been executed by the kernel.
We resolved this by hardcoding GOMEMLIMIT in the Deployment environment variables to roughly 85% of the pod limit, leaving 15% headroom for OS thread stacks and CGO allocations:
          env:
            - name: GOMEMLIMIT
              value: "1700MiB" # 85% of 2048Mi limit
            - name: GOMAXPROCS
              valueFrom:
                resourceFieldRef:
                  resource: limits.cpu
          resources:
            requests:
              memory: "1024Mi"
              cpu: "500m"
            limits:
              memory: "2048Mi"
              cpu: "1000m"
Actual Code Fix: While applying GOMEMLIMIT stopped the immediate crashes, memory utilization still climbed steadily over 48 hours. When we ran go tool pprof against the live staging service, we identified an unclosed API client response body in an internal HTTP loop—a classic Go memory leak trap:
// BAD: Leaks socket buffers and memory over time, eventually triggering Exit Code 137
resp, err := http.Get("http://internal-auth-service:8080/validate")
if err != nil {
    return err
}
// Processing without closing body...

// GOOD: Always defer the body closure immediately after checking the error
resp, err := http.Get("http://internal-auth-service:8080/validate")
if err != nil {
    return err
}
defer resp.Body.Close()
Node.js V8 Heap Traps
During the same migration, our frontend API Gateway (built on Node.js) consistently crashed at exactly 1.4GB of memory usage, regardless of whether we gave it a 2GB or 4GB limit in Kubernetes.
By default, 64-bit Node.js processes cap their old space heap at roughly 1.4GB. If your application needs more, it crashes with a JavaScript heap out-of-memory error. Conversely, if your pod limit is set to 1024Mi, Node.js will happily attempt to grow its heap to 1.4GB, resulting in a Linux cgroup OOMKilled event before V8 ever runs garbage collection.
We fixed this by passing --max-old-space-size directly via the NODE_OPTIONS environment variable, binding V8’s heap limit to 75% of the container’s hard memory limit:
          env:
            - name: NODE_OPTIONS
              value: "--max-old-space-size=1536" # 75% of 2048Mi limit
5. Moving from Whac-A-Mole to Precision: krr Sizing & eBPF Flamegraphs
Once runtime limits are aligned with container boundaries, you must eliminate manual guesswork from your resource allocations.
Sizing Quotas with Robusta krr
To strip away the “double it and pray” methodology, we integrated the open-source CLI Robusta Kubernetes Resource Recommendations (krr) into our weekly maintenance cycle. Unlike static calculators, krr connects directly to your Prometheus instance, analyzes two weeks of actual historical usage patterns, CPU throttling events, and OOM spikes, and calculates mathematically optimized requests and limits.
Running a scan against our production namespace generated immediate, actionable sizing adjustments:
krr simple --prometheus-url http://prometheus-k8s.monitoring.svc:9090 --namespace production
+-----------------------+-------------------+---------------------+---------------------+---------------------+
| Deployment            | Container         | Current Memory      | Recommended Memory  | Diff (%)            |
+-----------------------+-------------------+---------------------+---------------------+---------------------+
| analytics-ingestion   | ingestion-engine  | 4096Mi (Limit)      | 2048Mi (Limit)      | -50.0% (Overprovisioned)|
| payment-gateway       | payment-api       | 512Mi (Limit)       | 1024Mi (Limit)      | +100.0% (OOM Risk!) |
+-----------------------+-------------------+---------------------+---------------------+---------------------+
Catching Instantaneous Leaks with eBPF Profiling
When an application encounters an OOM kill, standard exception handlers fail because the kernel terminates the process instantly with SIGKILL. You cannot write a stack trace to disk if the OS shuts down the runtime in mid-instruction.
To catch complex memory leaks that survive runtime tuning, we deployed Parca (OOMProf) using eBPF (Extended Berkeley Packet Filter). Because eBPF probes attach directly to kernel-space memory allocation routines (malloc, mmap, and brk) with near-zero overhead, they track every memory allocation at the kernel level.
When the Linux OOM Killer triggers, the eBPF daemon intercepts the kill signal and dumps a high-resolution memory flamegraph of the exact stack trace that requested the fatal allocation at that exact millisecond. This allowed our SRE team to hand developers an undeniable line-by-line code trace of the leak, shifting the troubleshooting workflow from infrastructure guesswork to precise code remediation.
Kubernetes Official Documentation
cgroups v2 Architecture & Linux Kernel Isolation:Kubernetes Documentation: cgroups v2
Enforcing Pod Memory Boundaries:Kubernetes Documentation: Limit Ranges
Kubelet Resource Reclamations & Thresholds:Kubernetes Documentation: Node-pressure Eviction (Hard and Soft Eviction)
Vertical Pod Autoscaler (VPA) Configuration:Kubernetes Autoscaler: Vertical Pod Autoscaler (VPA) Documentation
