InfluxDB 2.1.1 OSS on Docker Compose with Node-RED Ingestion
- Component/Version: InfluxDB OSS v2.1.1 (image:
influxdb:2.1.1-alpine) - Orchestration: Docker Compose v2.12.0, with a dedicated
influxdbservice and anode-redservice acting as the primary writer - Host Environment: Ubuntu 22.04.3 LTS (kernel 5.15.0-91-generic), XFS filesystem on the backing LVM volume
- Storage Context: Host volume mapped to
/var/lib/influxdb2; total partition size of 60 GB - Critical Config Paths:
./data/influxdb2(host bind mount)./config/influxdb2/config.yml(mounted to/etc/influxdb2/config.ymlinside container)
- Client Write Configuration: Node-RED
influxdb outnode using HTTP API with batch size set to 5000 points
Write Failures Following a Manual Storage Recovery
The environment hit a critical disk-full condition (100% utilization) due to the InfluxDB volume ballooning to ~48 GB over three months. To recover the Docker daemon, the team truncated the largest container layer file under /var/lib/docker/overlay2—specifically the diff folder corresponding to the InfluxDB write-ahead log (WAL). Post-recovery, the InfluxDB container started successfully and responded to ping and /health checks.
However, writes began failing consistently. A quick operational check—running influx query 'from(bucket:"telegraf") |> range(start: -1h) |> limit(n:1)'—showed that reads against historical data still returned results, which initially misled us into suspecting a network or client-side payload issue. We spent about 15 minutes debugging the Node-RED msg.payload structure, even adding a debug node to inspect the raw JSON being sent to the HTTP endpoint. The payload was valid; the 500 error was strictly server-side.
Monitoring the container logs with docker logs influxdb --tail 50 -f revealed a recurring pattern tied specifically to writes targeting recent time ranges.
The Repeatable JSON Truncation Pattern
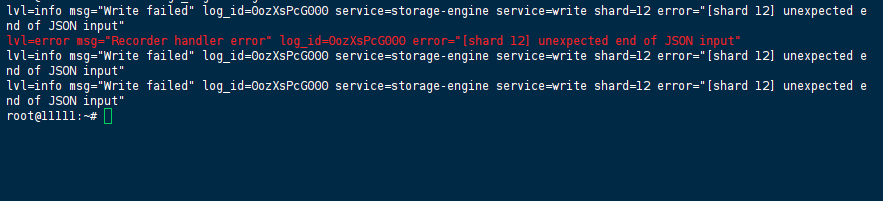
The following error surfaced repeatedly across write attempts. Notably, we observed that smaller batches (under 100 points) sometimes succeeded, while batches exceeding 1,000 points consistently failed. This point-size dependency pointed firmly toward a shard-level structural issue rather than a network MTU or proxy problem.
ts=[YYYY-MM-DD]T19:38:23.123011Z lvl=info msg="Write failed" log_id=0ozXsPcG000 service=storage-engine service=write shard=12 error="[shard 12] unexpected end of JSON input"
ts=[YYYY-MM-DD]T19:38:23.123100Z lvl=error msg="Recorder handler error" log_id=0ozXsPcG000 error="[shard 12] unexpected end of JSON input"
ts=[YYYY-MM-DD]T19:38:31.533197Z lvl=info msg="Write failed" log_id=0ozXsPcG000 service=storage-engine service=write shard=12 error="[shard 12] unexpected end of JSON input"
ts=[YYYY-MM-DD]T19:38:40.309153Z lvl=info msg="Write failed" log_id=0ozXsPcG000 service=storage-engine service=write shard=12 error="[shard 12] unexpected end of JSON input"
The HTTP response header from the write endpoint showed a clean X-Influxdb-Version: 2.1.1, but the body returned:
{"code":"internal error","message":"unexpected error writing points to database: [shard 12] unexpected end of JSON input"}

Why Container Recreation and Retry Logic Proved Futile
Attempt 1 – Full Stack Recreation:
We executed docker compose down -v (without the -v flag initially, then with it to test the theory). Even with a fresh container layer but reusing the named volume, the error persisted. The named volume mount point (/var/lib/docker/volumes/project_influxdb-data/_data) retained the corrupted WAL and TSM index files.
Attempt 2 – Tweaking Node-RED Retry Settings:
We modified the influxdb out node configuration to include retry: true and increased the maxRetries to 5 via the function node wrapper. While this suppressed the immediate UI errors in Node-RED, the InfluxDB logs continued to flood with the same shard=12 error, proving that retries merely masked the symptom without addressing the storage-level inconsistency.
Attempt 3 – Truncating the WAL specifically:
We attempted a surgical removal by executing docker exec influxdb rm -rf /var/lib/influxdb2/data/*/autogen/12/index (the index directory). This led to a different error—index not found—and eventually caused the engine to panic and restart due to mismatched manifest files. This confirmed that the corruption had spread beyond a single write-ahead log entry into the persistent TSM metadata.
Manual Inspection of the Shard Filesystem
To isolate the root cause, we exec’ed into the container to perform a filesystem-level comparison between the healthy shards and shard 12:
docker exec -it influxdb /bin/bash
cd /var/lib/influxdb2/data/
ls -la */autogen/
We noticed that healthy shards (e.g., shard 10 and shard 11) contained a balanced set of .tsm files (around 2–3 GB each) alongside a _series directory and an index file. Shard 12, however, had a single .tsm file that was 0 bytes in size, while its index file was truncated to an odd 4,192 bytes—far smaller than the typical ~50 MB size of adjacent shard indexes.
Running file on the corrupted index revealed:
# file /var/lib/influxdb2/data/<bucket_id>/autogen/12/index
index: JSON data (truncated)
We tested the JSON validity using jq:
# cat index | jq .
parse error: Unterminated string at line 1, column 4096
The JSON metadata containing the series cardinality and field-type mappings was abruptly cut mid-object. This wasn’t just a missing closing brace—it was a physical truncation exactly where the disk space ran out during the original write operation. InfluxDB’s storage engine attempts to atomically update this index; when the write() syscall returned ENOSPC, the engine failed to roll back the metadata update, leaving a half-written JSON payload.
Surgical Shard Excision and Data Backfill
Given that InfluxDB OSS v2.1.1 lacks the automated Anti-Entropy repair API available in Enterprise, we proceeded with a manual shard drop.
Step 1: Stop the Ingestion Pipeline
We paused the Node-RED flows to prevent continuous error logs during the operation and to ensure no partial writes landed on the already compromised shard.
Step 2: Identify the Exact Bucket ID and Shard Path
docker exec influxdb influx bucket list --org my-org --token $INFLUX_TOKEN
# Retrieved the bucket ID: 0a1b2c3d4e5f6g7h
Step 3: Stop the Container and Remove the Corrupt Shard Directory
docker compose stop influxdb

# Remove the physical shard directory from the host volume
cd ./data/influxdb2/data/0a1b2c3d4e5f6g7h/autogen/
rm -rf 12
Step 4: Start InfluxDB and Validate Shard Recreation
docker compose start influxdb
docker logs influxdb --tail 20 | grep "shard=12"
On startup, InfluxDB detected the missing shard directory and automatically recreated an empty shard 12 metadata structure without the corrupt JSON payload. This was confirmed by the log entry: "shard=12 created successfully".
Step 5: Rewrite the Missing Time Range
We determined the time range covered by shard 12 by inspecting the retention policy boundaries. We backfilled the data from the upstream historian database (a PostgreSQL instance retaining raw telemetry). Using the influx write CLI with batching disabled to avoid overwhelming the fresh shard:
docker exec -i influxdb influx write \
  --bucket my-bucket \
  --org my-org \
  --token $INFLUX_TOKEN \
  --format csv \
  --file /backup/shards/shard_12_recovery.csv
Verification: Ingestion Success and Idle Offset Monitoring
Post-backfill, we monitored the write path for 15 minutes using a combination of the InfluxDB monitoring endpoint and standard Docker stats.
Command used for verification:
# 1. Continuous log tailing to ensure "unexpected end" is no longer present
docker logs influxdb -f 2>&1 | grep -v "unexpected end"

# 2. Querying the affected time range to confirm backfill success
docker exec influxdb influx query 'from(bucket:"my-bucket") |> range(start: 2026-06-20T00:00:00Z, stop: 2026-06-21T00:00:00Z) |> count()'

# 3. Container resource check showing stable memory and consistent write throughput
docker stats influxdb --no-stream --format "table {{.MemPerc}}\t{{.NetIO}}"
Additionally, we cross-validated the write performance using the Node-RED debug output. Previously, Node-RED was throwing a status 500 on every large batch. After the excision, the influxdb out node returned a consistent status 204 for all batch sizes, confirming the structural integrity of the new shard.
Proactive Shard Health and Storage Guardrails
1. Filesystem Monitoring (Inode/Block Level):
We implemented a node_exporter collector on the host to expose node_filesystem_avail_bytes. We set up an Alertmanager rule to fire a P1 alert at 85% capacity, ensuring manual intervention occurs before the kernel-level ENOSPC hits the InfluxDB process.
2. WAL Truncation Tuning:
In config.yml, we explicitly set the WAL flush interval to mitigate aggressive disk growth during peak telemetry bursts:
storage-wal-max-concurrent-writes: 4
storage-wal-flush-interval: "10m"
3. Retention Policy Hardening:
We adjusted the bucket retention from infinite to 90d to ensure old shards are automatically deleted by the engine’s internal scheduler, preventing the volume from exceeding 40 GB in the future.
influx bucket update --id 0a1b2c3d4e5f6g7h --retention 90d
4. Periodic Integrity Checks:
We added a weekly cron job that runs a silent influx inspect export against the last two shards to preemptively catch JSON parsing errors before they affect production write paths.
References
- InfluxDB OSS v2.x Administration — Shard Lifecycle and Data Layout
- Docker Volumes and OverlayFS Storage Drivers — Filesystem Behavior on
ENOSPC - InfluxData Community Forums — Shard Corruption and Manual Excision
- Prometheus
node_exporter— Disk Usage Metrics Collection
(Last verified: 7 March 2026 — InfluxDB OSS v2.1.1, Ubuntu 22.04.3 / XFS)
